
1.- Initial considerations
All the variable are independent with respect to the teachers groups (@grupo). The group 1 is the teachers group who answered the survey for the first time in October, 2015 and the group 2 answered in June, 2016.
The labels are not in the charts because most of the them use the same references. In ordinal variables regarding how often something happens, the labels are:
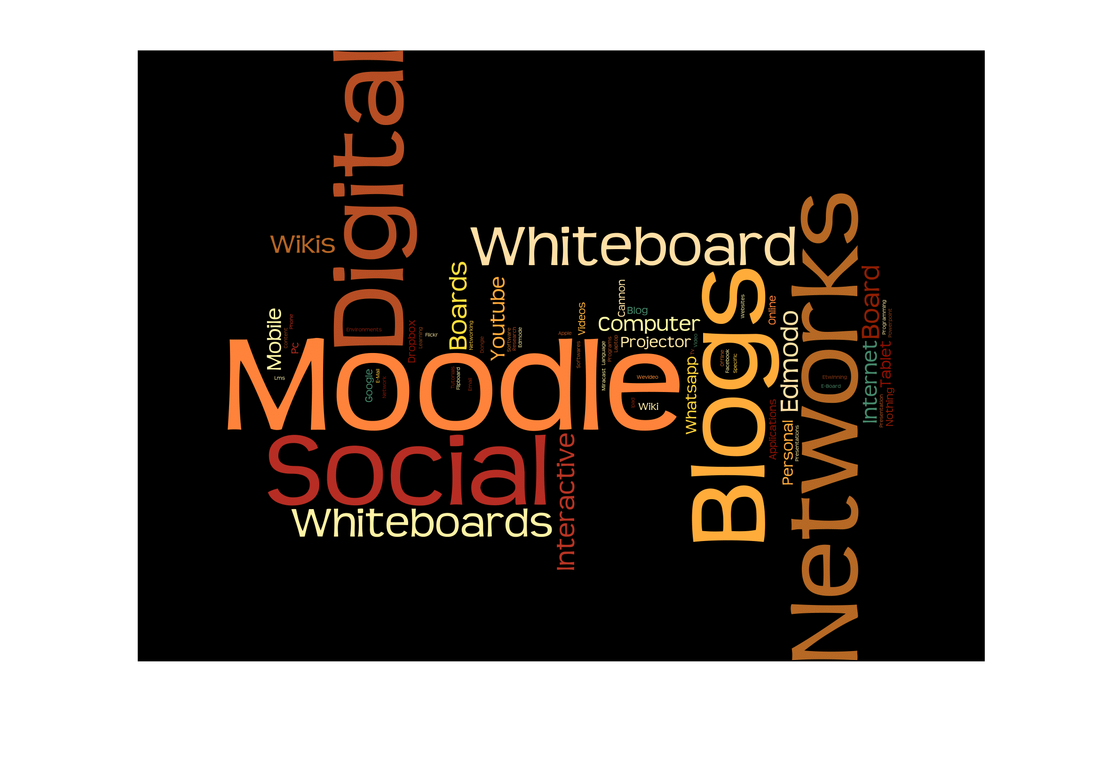
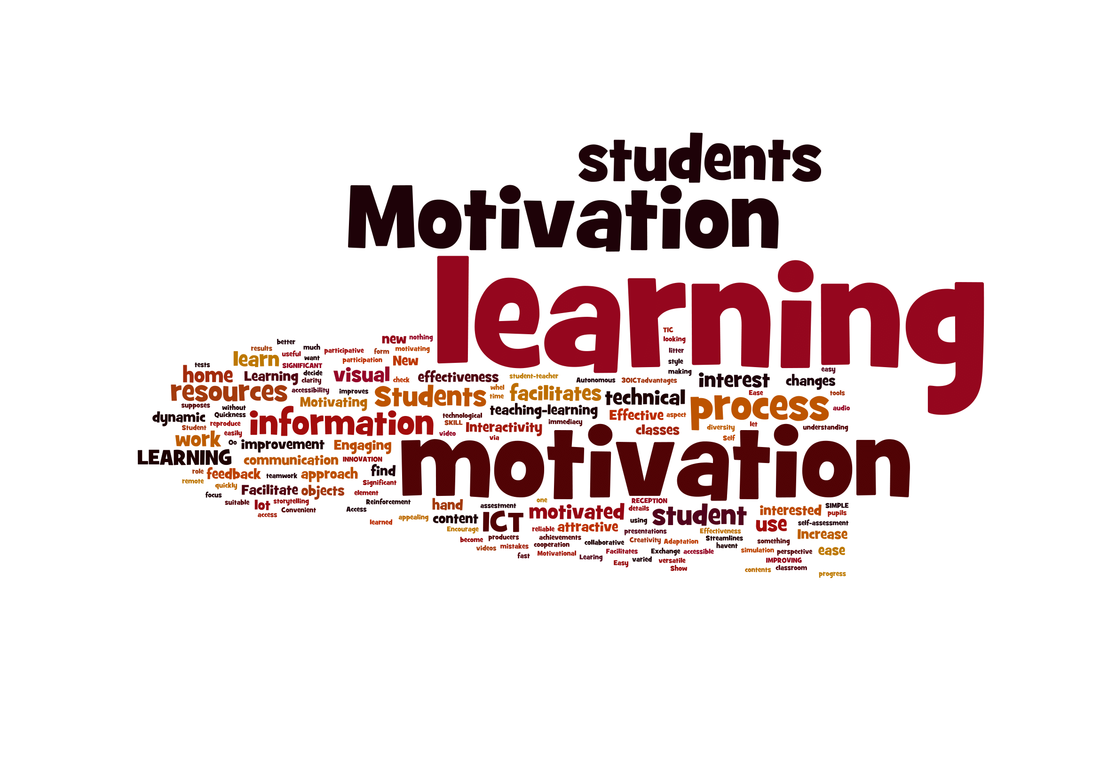
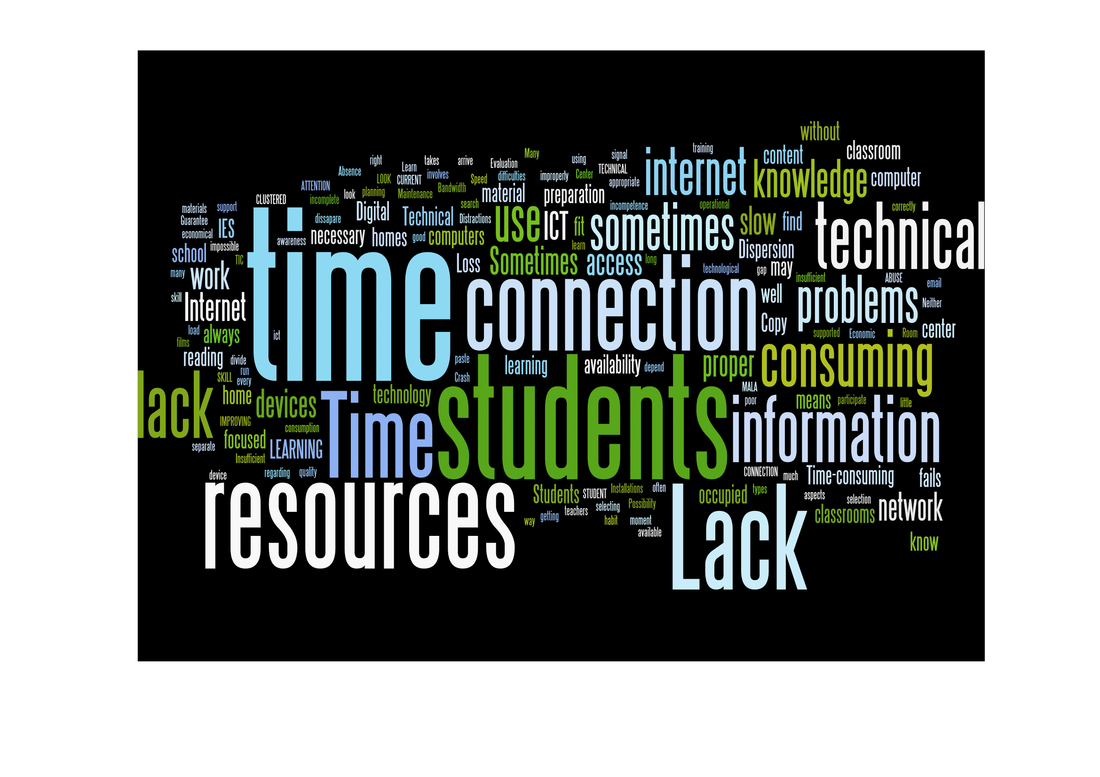
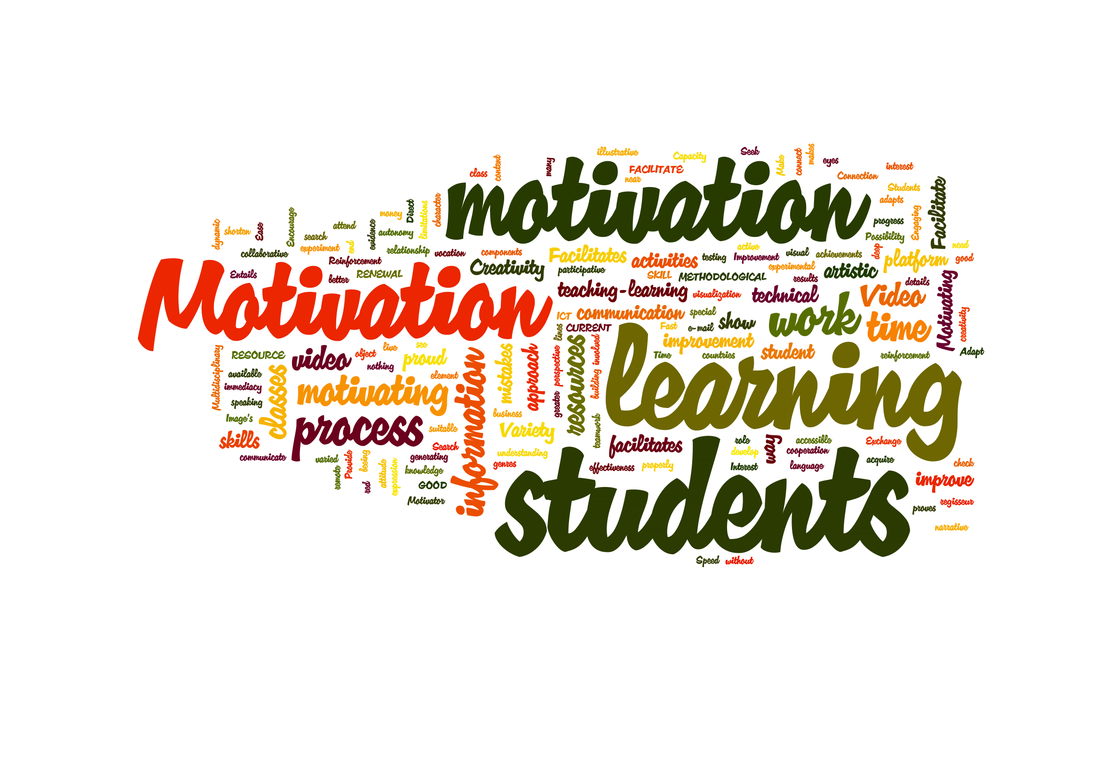
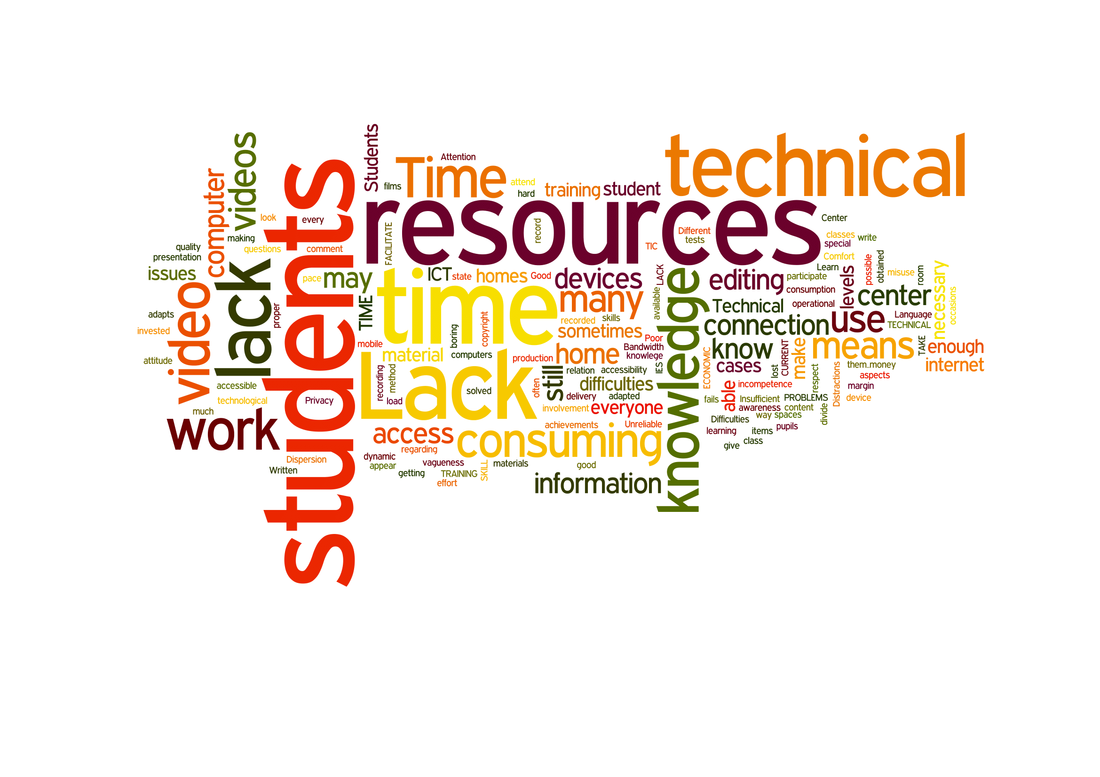
Regarding the open questions in the survey, the answers are plotted in a Wordle chart taking into account the number of repetitions (frequency). Then, the words with high frequency are bigger than the words less likely to be in the answers.
Data are not normally distributed so the contrasts of hypothesis based on the normal are not permitted in this statistical study. Since we cannot guarantee the normal distribution, the test should be non parametric such as the Mann-Whitney U-Test and the Wilcoxon W-Test. Furthermore, we applied the Monte Carlo method based on 10000 sampled tables.
The labels are not in the charts because most of the them use the same references. In ordinal variables regarding how often something happens, the labels are:
- 1: never
- 2: seldom
- 3: sometimes
- 4: often
- 5: almost always
- 1: strongly disagree
- 2: disagree
- 3: undecided
- 4: agree
- 5: strongly agree
Regarding the open questions in the survey, the answers are plotted in a Wordle chart taking into account the number of repetitions (frequency). Then, the words with high frequency are bigger than the words less likely to be in the answers.
Data are not normally distributed so the contrasts of hypothesis based on the normal are not permitted in this statistical study. Since we cannot guarantee the normal distribution, the test should be non parametric such as the Mann-Whitney U-Test and the Wilcoxon W-Test. Furthermore, we applied the Monte Carlo method based on 10000 sampled tables.
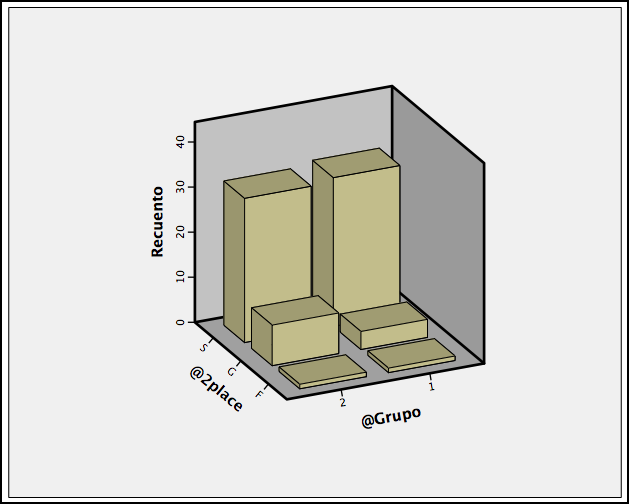
2.- Place of your educational centre
As we can see, the number of teachers participating in the project remained almost the same. It increased in two teachers in the second survey.
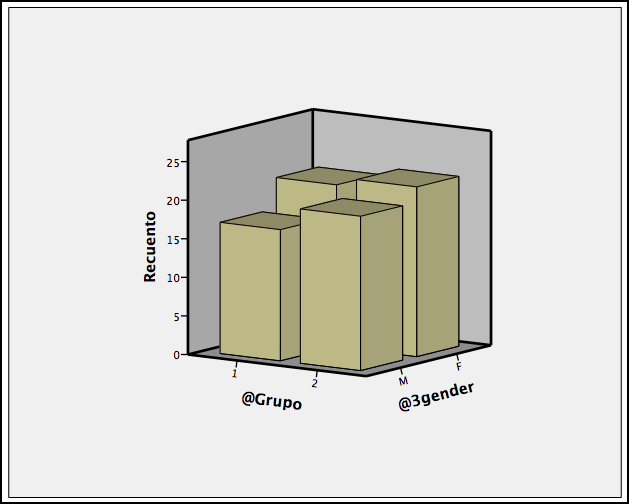
3.- Gender
Males and females were similar during the project. The gender were uniformly distributed in the sample.
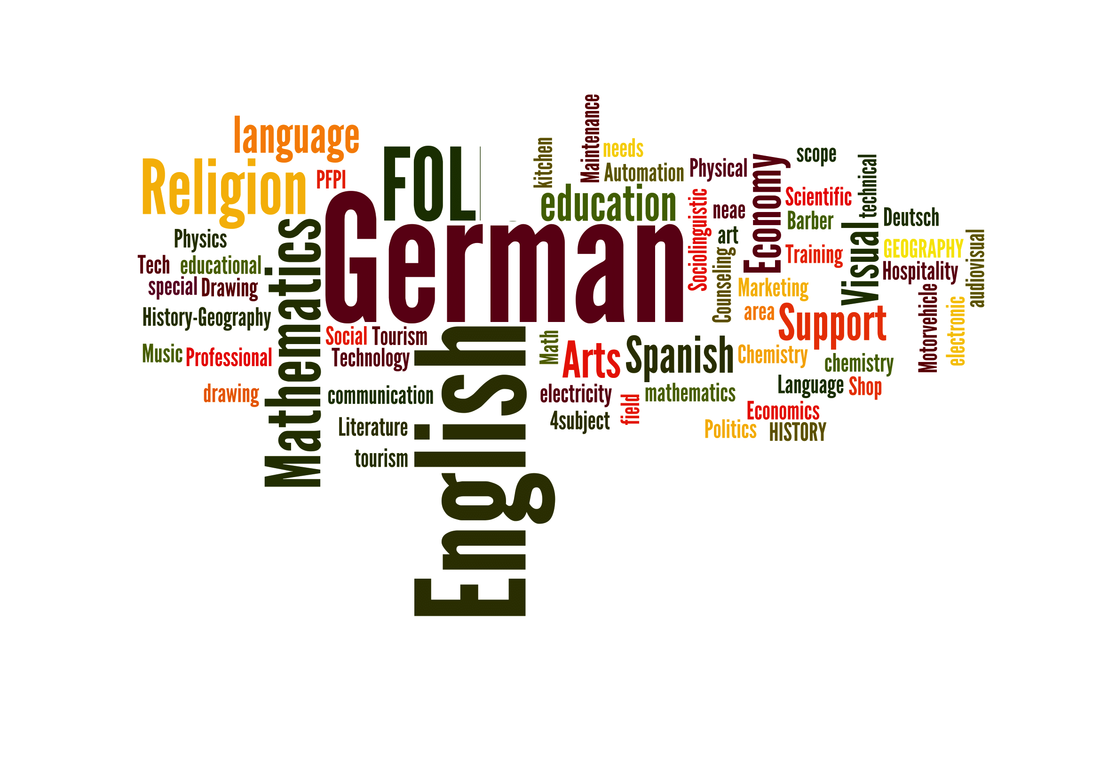
4.- Subject you teach
The most frequent subjects in the project are German, English, Religion, Mathematics, Formation and Labour Orientation, etc. This wide variety helps to avoid statistical bias due to the presence of a given subject.
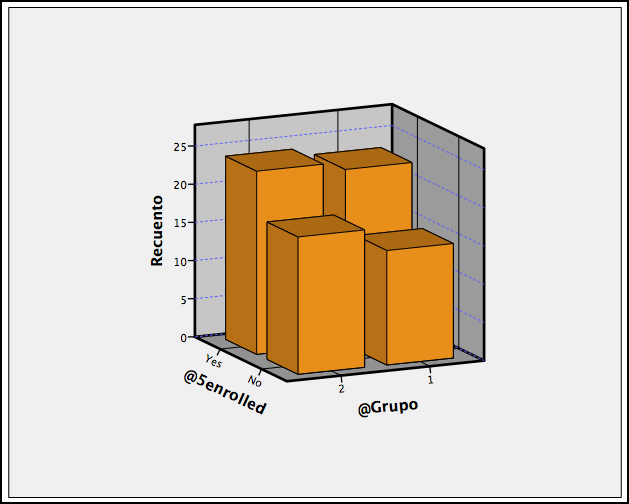
5.- Are you enrolled in the Erasmus + Project Recording our Europe?
Although in the second group there are a few teachers less than in the first group, the difference is not significant.
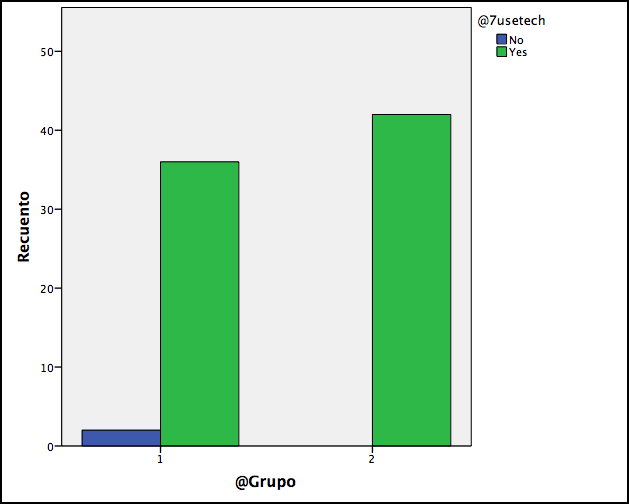
6.- Do you use technological means in your classes?
The people who participated in the surveys mostly use technological means while teaching so the sense of this statistical study is oriented to the video skills improvement instead of getting teachers involved in using the video in the classroom.
It is necessary to guarantee the participation of non involved teachers in order to study better the project impact on them.
It is necessary to guarantee the participation of non involved teachers in order to study better the project impact on them.
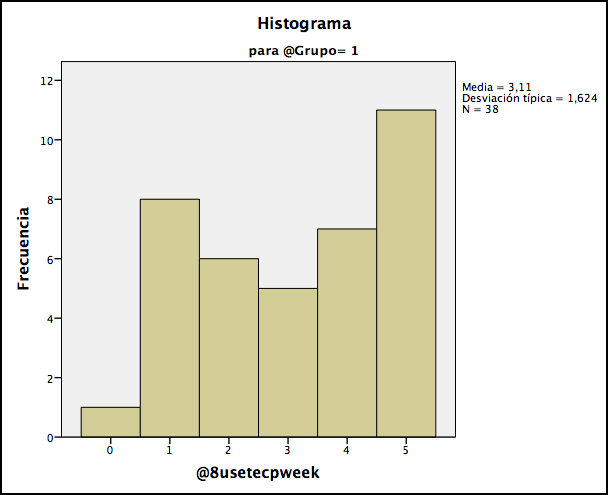
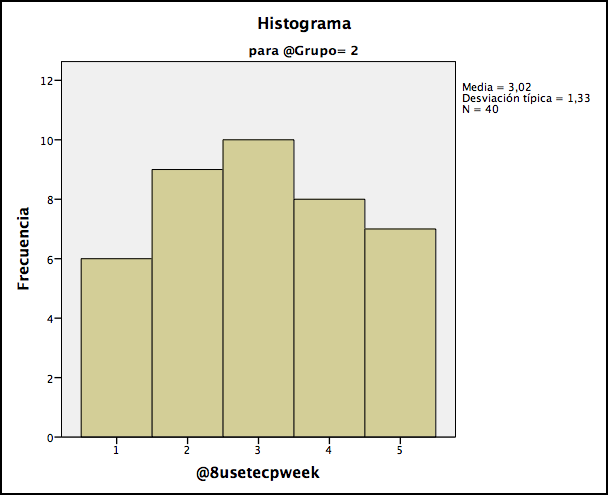
7.-How often per week do you use the technological means with a group of students?
|
|
The number of times teachers use the technologic means has changed in the distribution of the data. During the first survey, there were teacher not using the technologic means with the students. Moreover, the number of teachers using tech once a week decreased in the second survey.
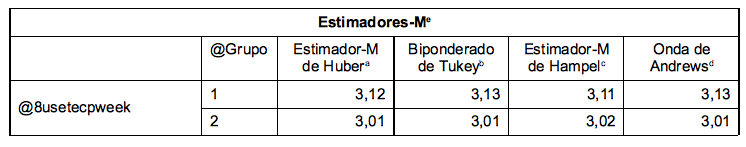
The means area similar: 3.11 and 3.07, as we can see below:
The means area similar: 3.11 and 3.07, as we can see below:
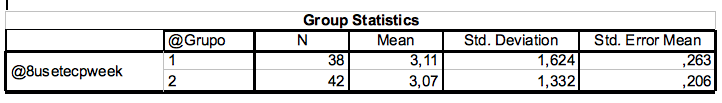
In fact, the M-estimators are very closed in both groups. See the values below:
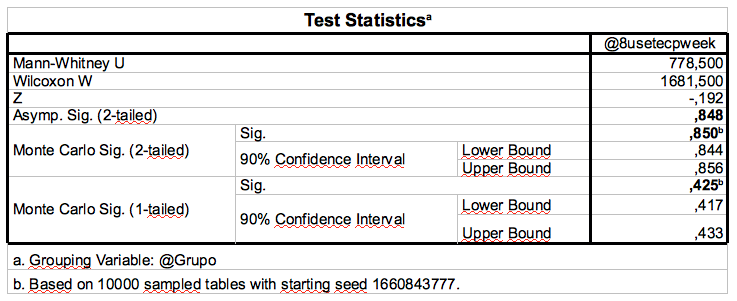
The Mann-Whitney U-test contrasts the null hypothesis that is there is no difference between both groups regarding how often teachers use technological means with their students versus the alternate hypothesis there is a difference between both groups regarding how often teachers use technological means with their students.
The p-values are greater than 0,05 so we cannot reject the null hypothesis. It means that we have not enough information to find a difference.
The p-values are greater than 0,05 so we cannot reject the null hypothesis. It means that we have not enough information to find a difference.
8.- Do you use the video in your classes to develop learning processes?
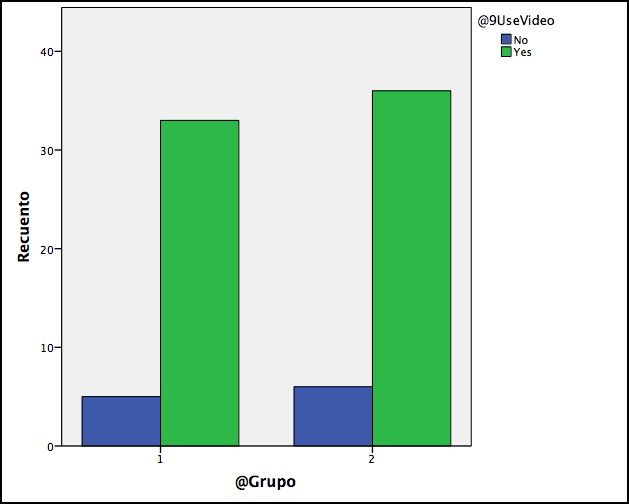
There is a small difference between both groups although the use of the video has slightly increased at the end of the project.
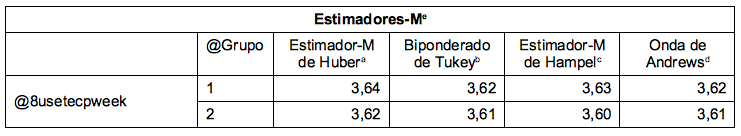
9.- How often per week do you use the video with a group of students?
|
|
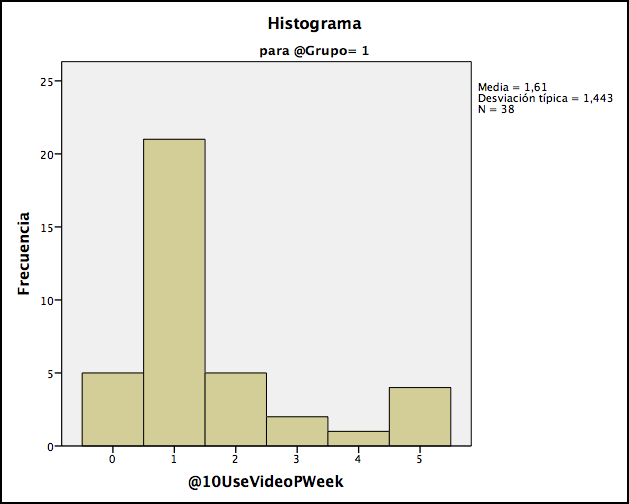
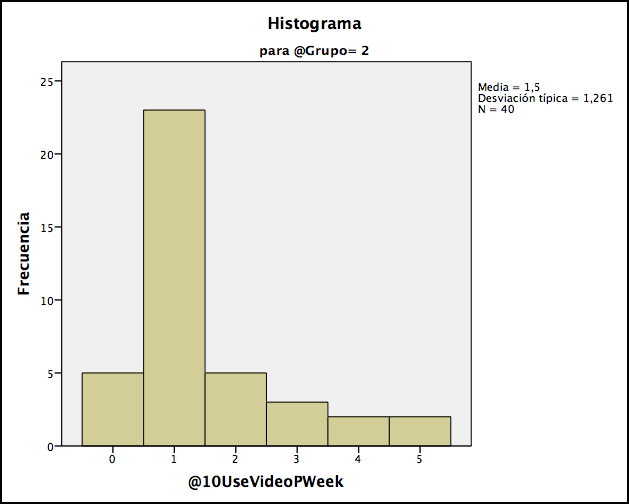
In a simple view, the data distribution are similar so both distributions are based in the median which cause some problems when calculating the M-estimators. The median is 1 so at least 50% of the teachers use the video maximum once a week. The other half of the teachers are distributed along the other values (from 2 to 5 times).
10.- Do you ask the students to record videos in order to show what they have learnt?
|
|
In this case, 1 stands for never while 5 stands for almost always. So apparently, students are more likely to records videos after teachers get involved in the project.
In order to contrast that, we run the Mann-Whitney U test:
In order to contrast that, we run the Mann-Whitney U test:
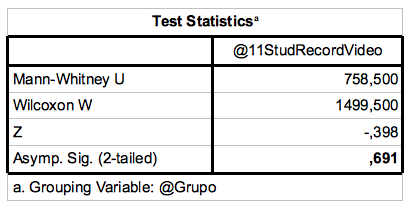
We contrast if the participation in the project influence teachers by assigning video recordings in order to assess learning. The p-value of the contrast is 0,691 that is greater than 0,05 so we cannot reject the null hypothesis, that is, we have not enough information to say that there is a difference.
11.- How many videos per quarter do you ask your students to record? Type an approximate number.
|
|
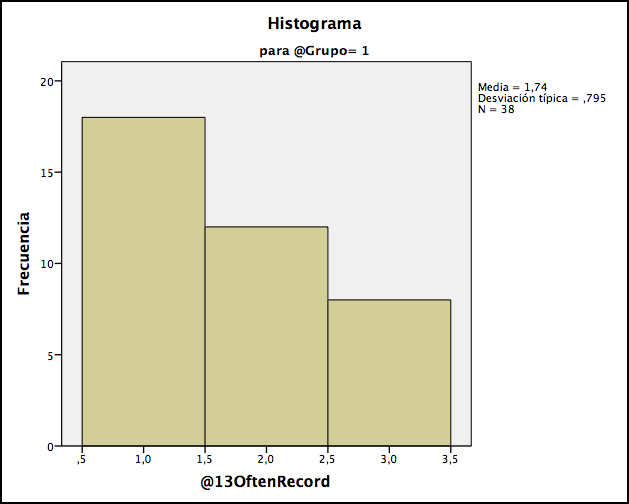
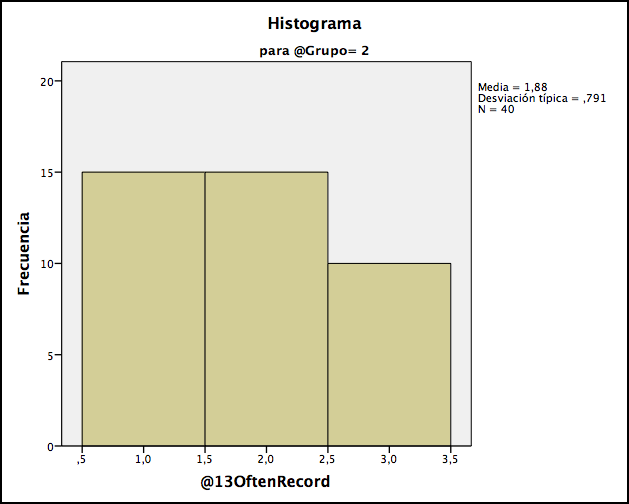
12.- How often do you record videos for your students such as videotutorials?
|
|
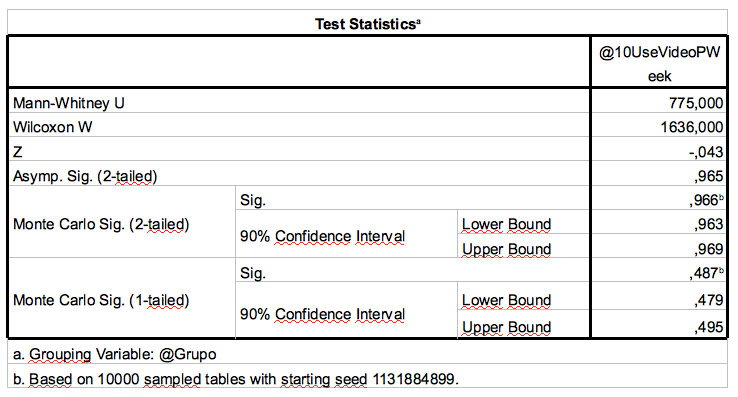
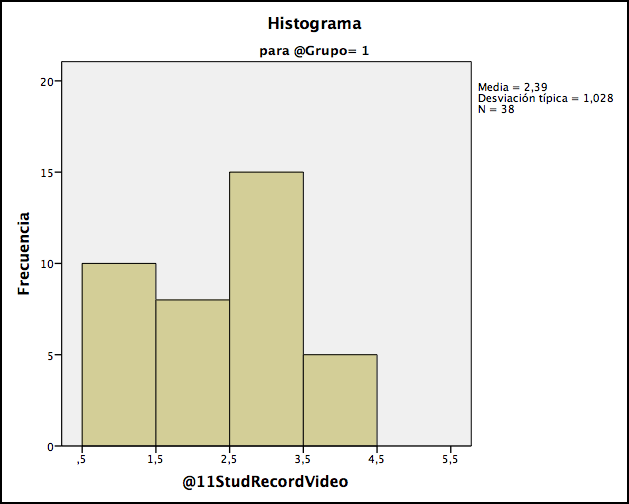
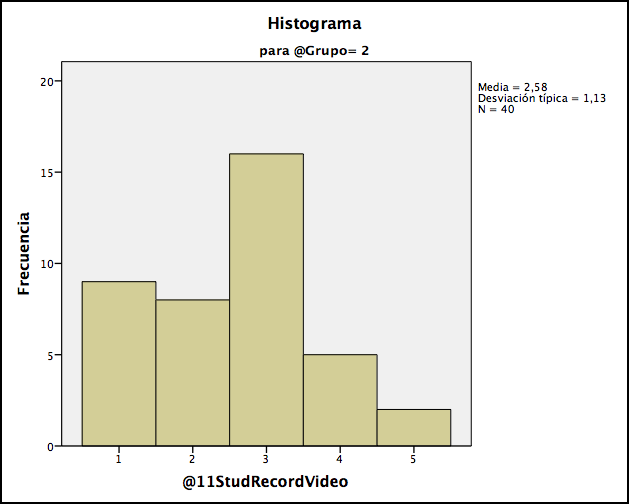
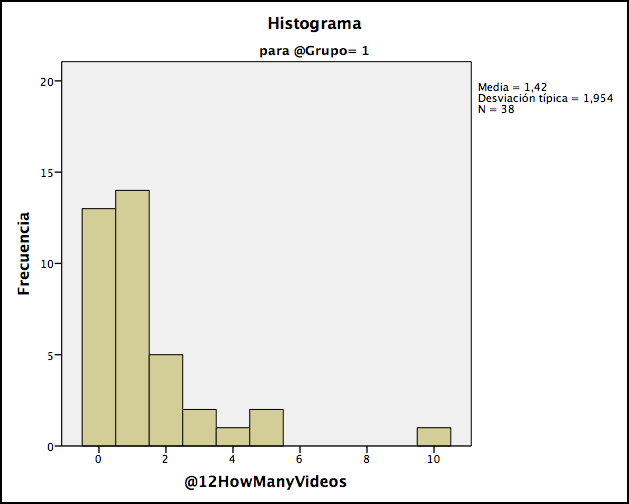
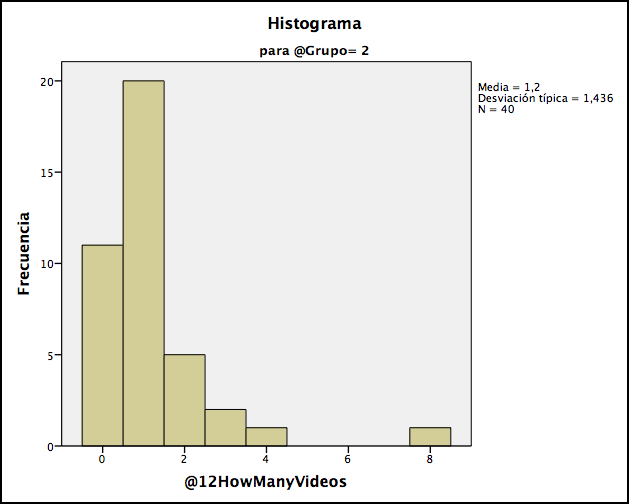
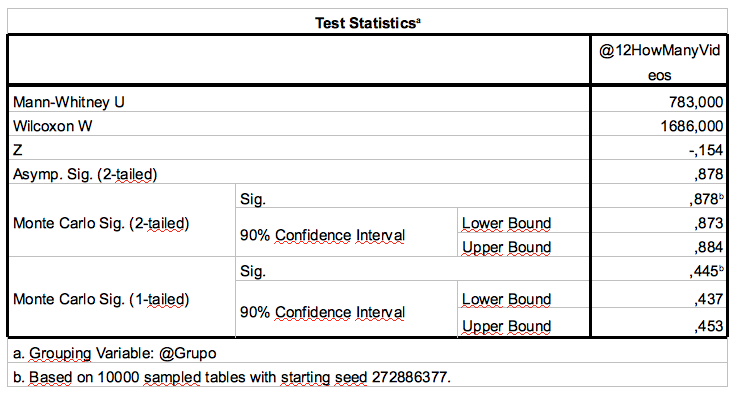
Although the charts of frequencies are not similar, the Mann-Whitney U-test gives a p-value of 0,38 greater than 0,05 which means that the teachers have not change the numbers of video recorded for their students.
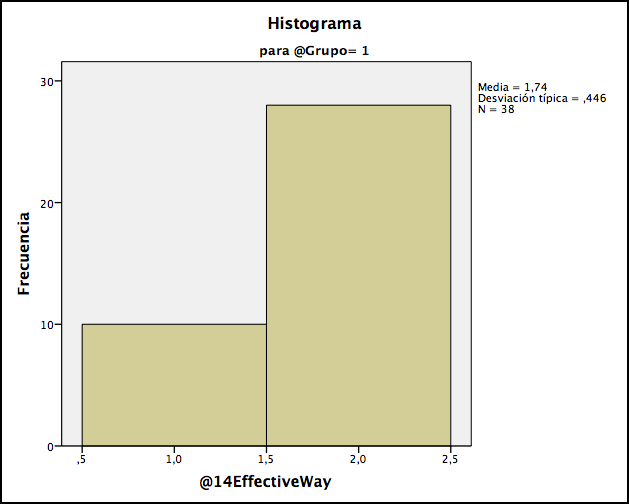
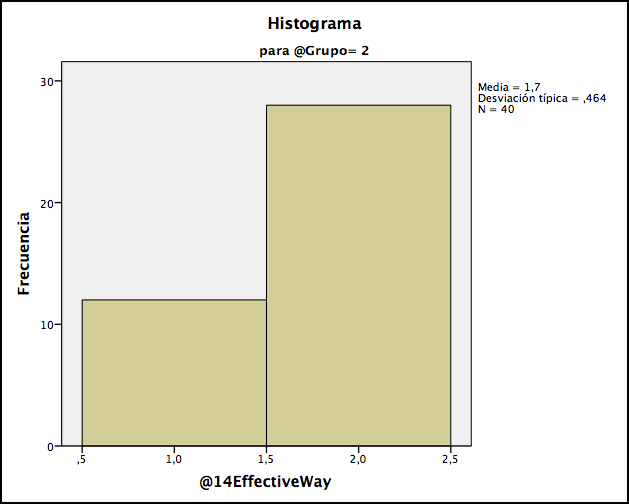
13.- What is the most effective way of learning?
|
|
Teachers after and before participating in the project think that the most effective way of learning is video production (2) instead of just watching videos (1).
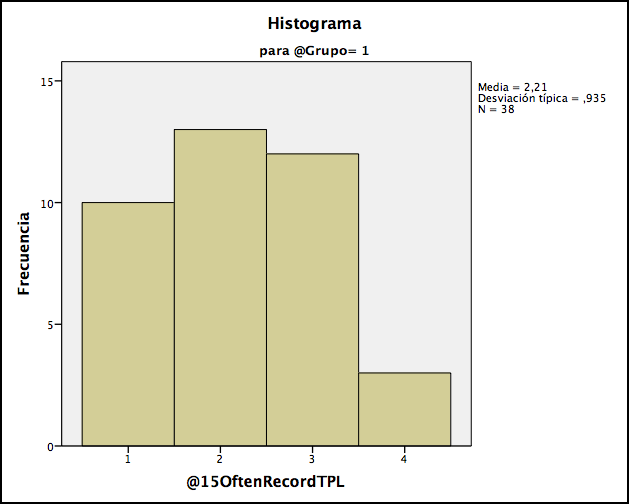
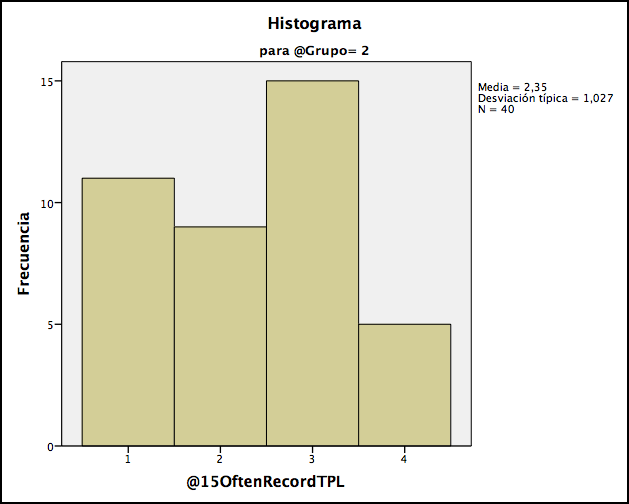
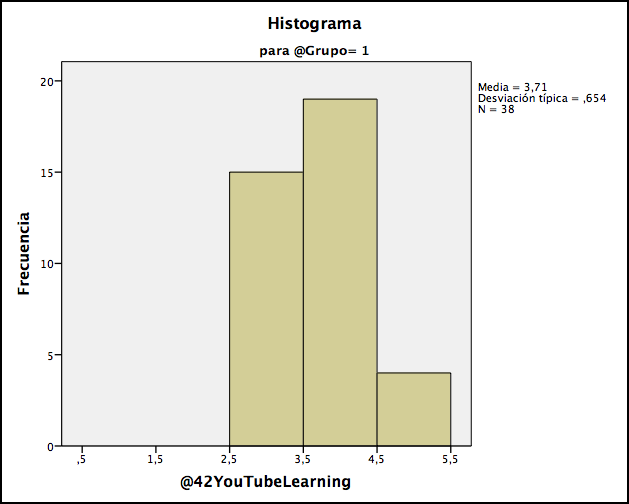
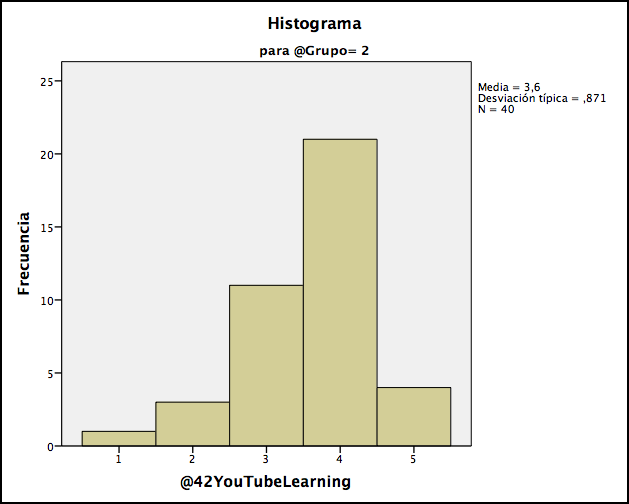
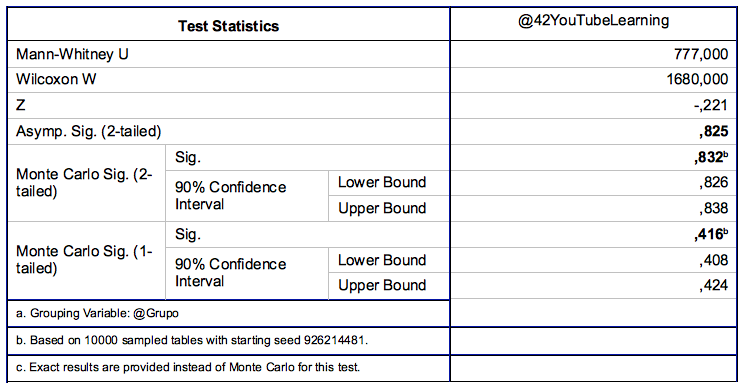
14.- How often do you ask your students to record videos in order to produce learning?
|
|
The p-value for the Mann-Whitney U-test is 0,654 greater than 0,05 so the participation in the project does not influence how often teachers ask student to record videos.
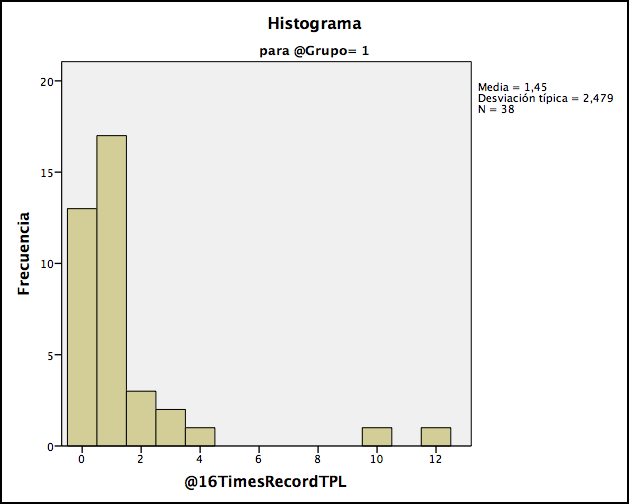
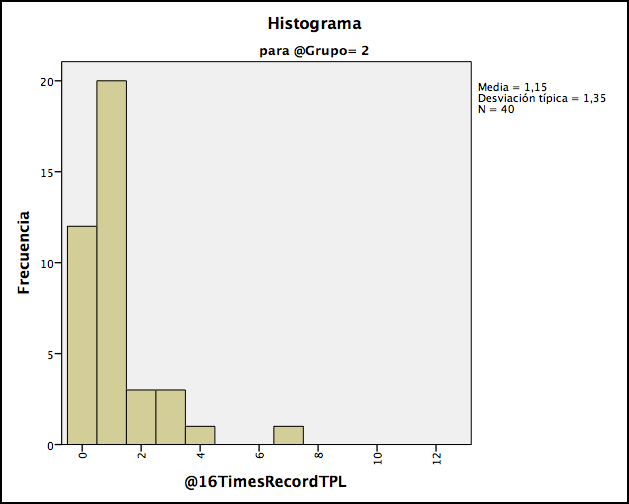
15.- How many times per quarter do you ask your students to record videos in order to produce learning?
|
|
There are no changes in the number of videos requested to produce learning.
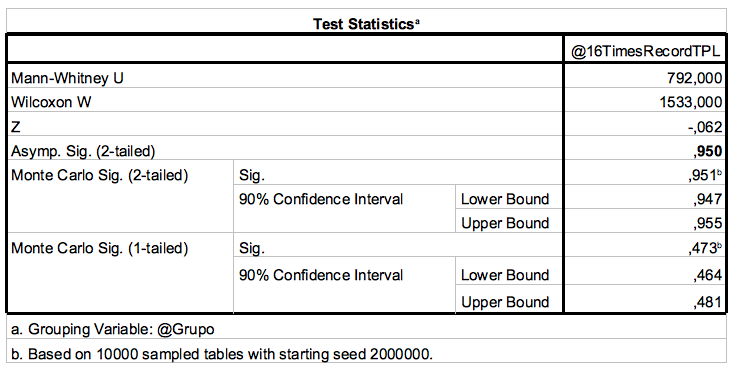
As we can see in the table above, the p-value is 0,950 greater than 0,10 so there is no influence in both groups regarding the number of videos requested to the students in order to develop the learning processes.
Furthermore, 1-tailed and 2-tailed Monte Carlo methods were run with a 0.10 significance level and the p-values were 0,951 and 0,473, both greater than 0,05. It reaffirms our first conclusion.
Furthermore, 1-tailed and 2-tailed Monte Carlo methods were run with a 0.10 significance level and the p-values were 0,951 and 0,473, both greater than 0,05. It reaffirms our first conclusion.
16.- Before the starting of the Proyect Recording Our Europe, my ICT skills were …
|
|
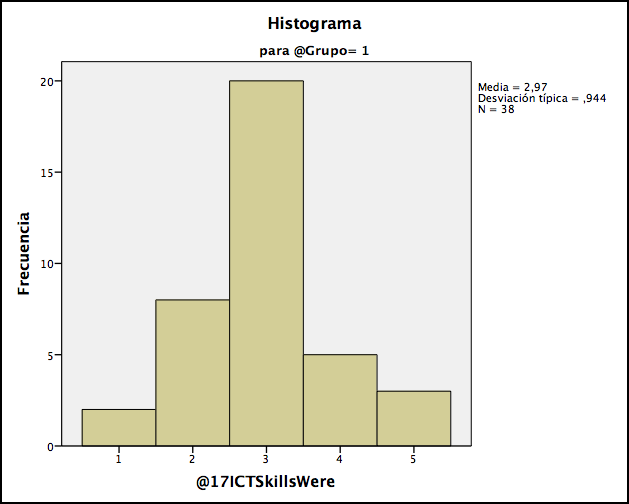
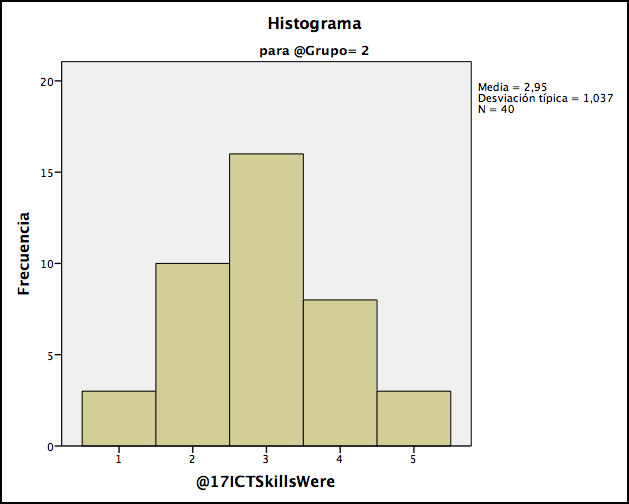
Now, we test if there is a difference in the ICT skills among the teachers at the beginning and at the end of the project. So the null hypothesis is that there is no difference in it. From different tests we obtain the p-values below.
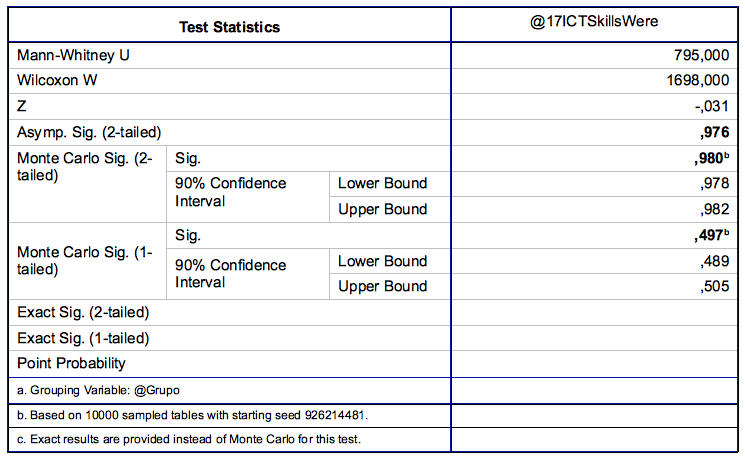
All of them are greater than 0,05, so there is no difference between the two moments related to the ICT skills.
17.- Choose the grade of agreement with the sentence: "Participating in the ROE * Project has contribuited to enhance my ICT skills"
|
|
As we can see above, the three p-values are greater than 0,05 so there is no difference regarding the enhancement of the ICT skills while participating in the project.
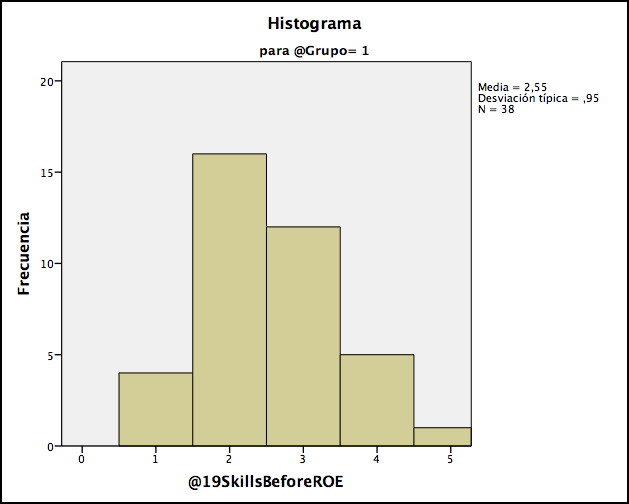
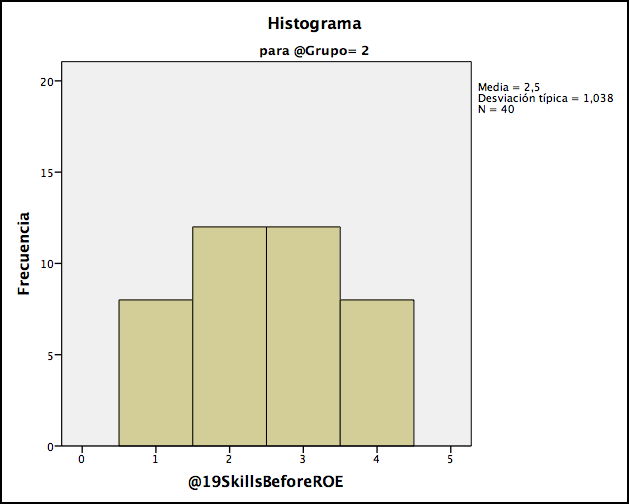
18.- Before the start of the ROE Project, my skills in the use of video were...
|
|
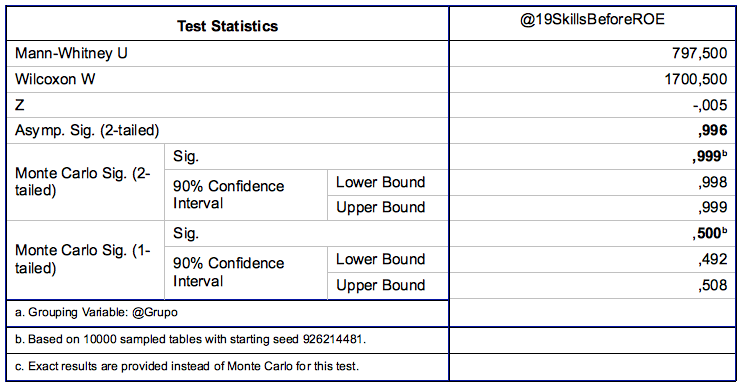
The p-values are greater than 0,05 so we cannot conclude that there is a difference in the teachers’ video ICT skills before and after their participation in the project.
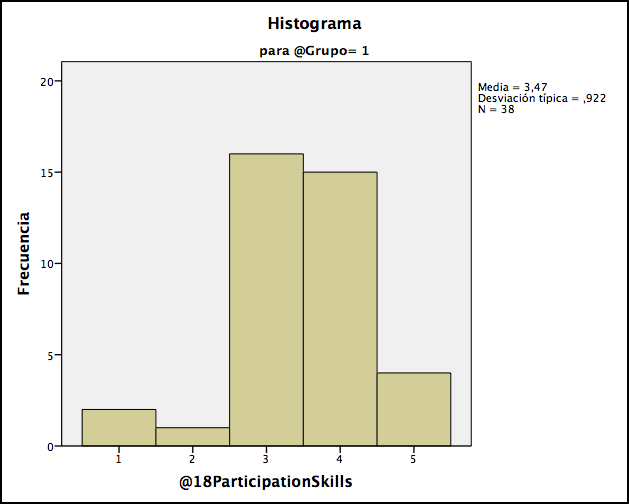
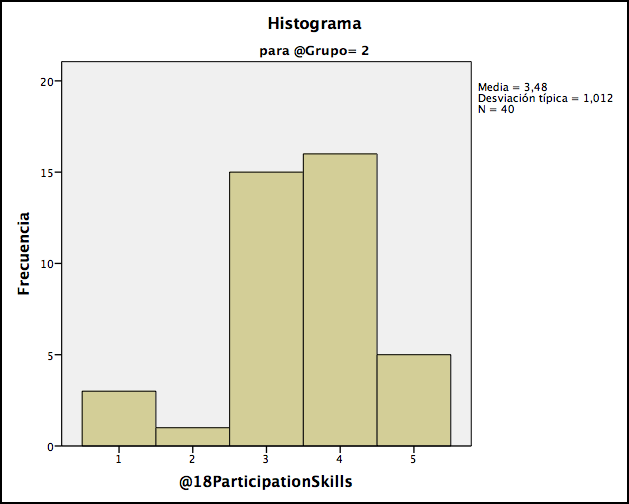
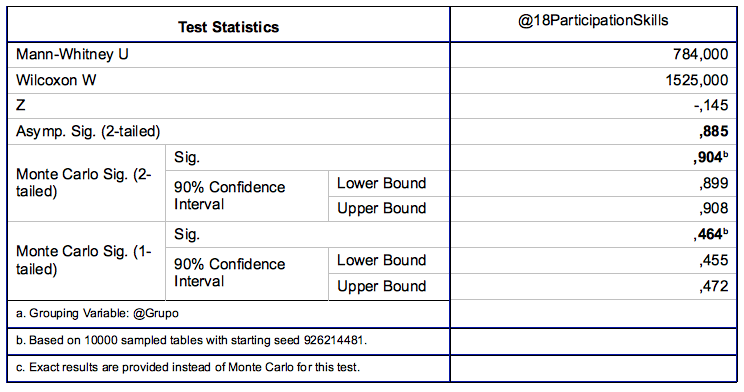
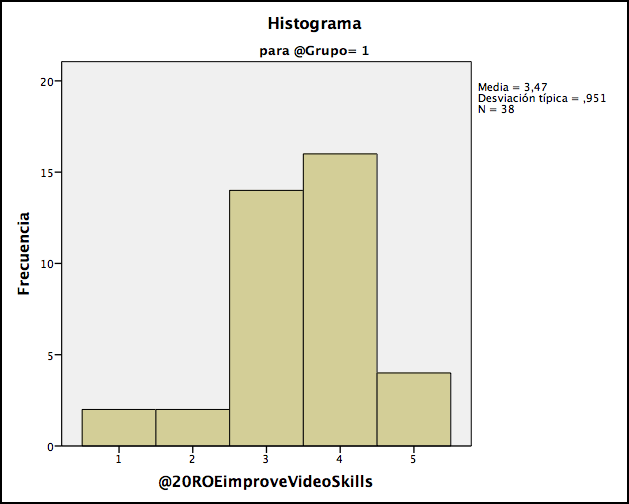
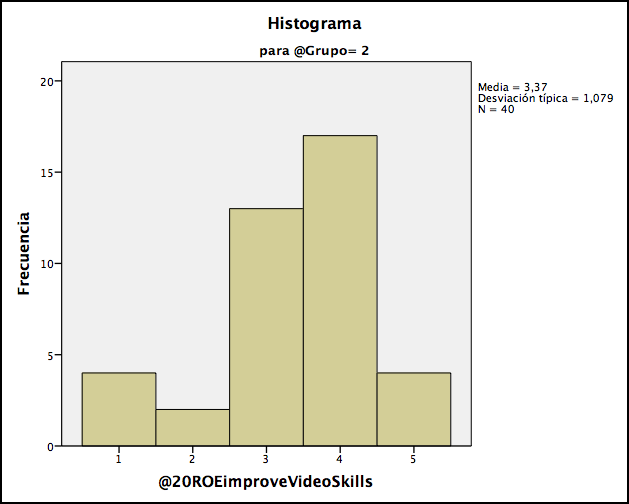
19.- Choose the grade of agreement with the sentence: "Participating in the ROE Project has contributed to enhance my video skills".
|
|
The p-values are greater than 0,05 so participating in the project does not involve an enhancement of the teacher’s video skills.
20.- Write the name of the devices with which you are able to record videos.
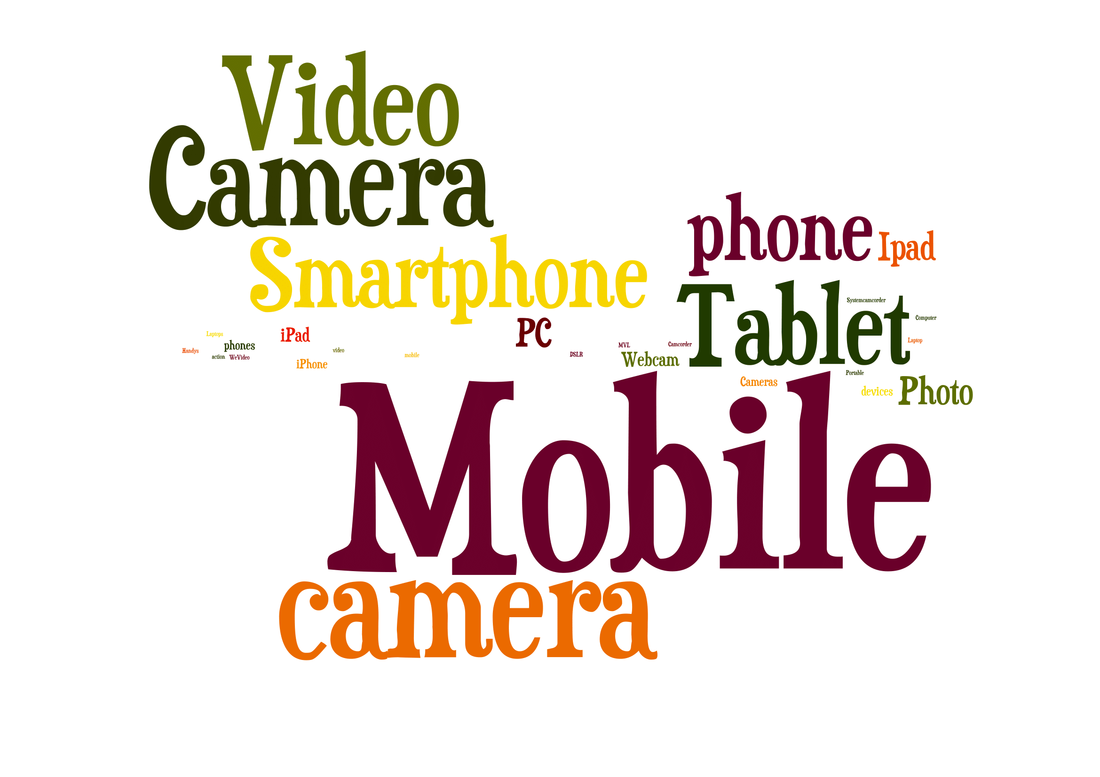
The answer are clear: mobiles, cameras, smartphones, video cameras, tablets, etc. All of them are devices that people use daily and have at hand.
21.- Choose a grade of agreement: "I can record videos with the appropriate devices and software"
|
|
Teachers do not need to be involved in the project to change their ability to record videos since the p-values of the contrasts are greater than 0,05.
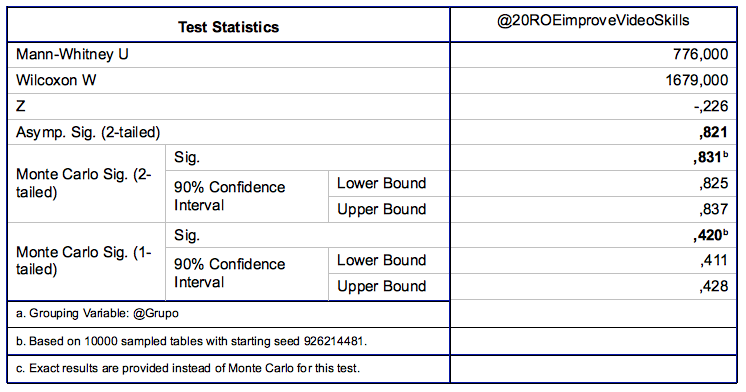
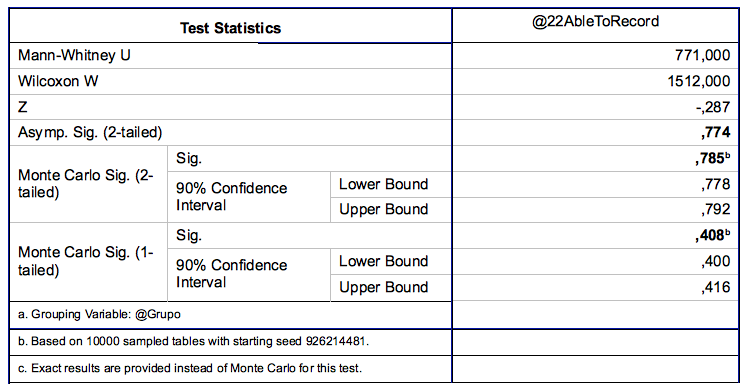
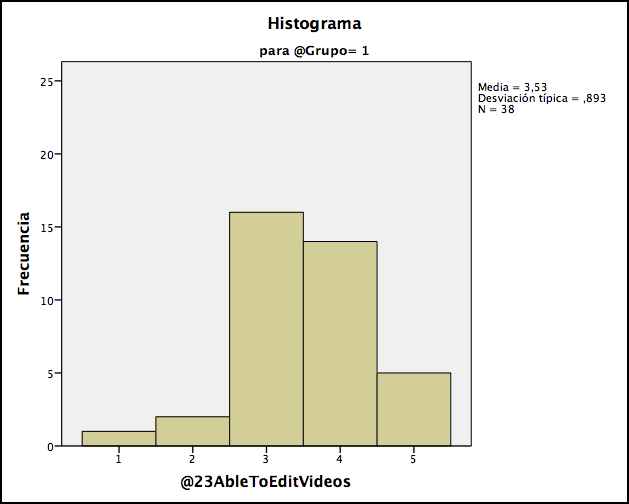
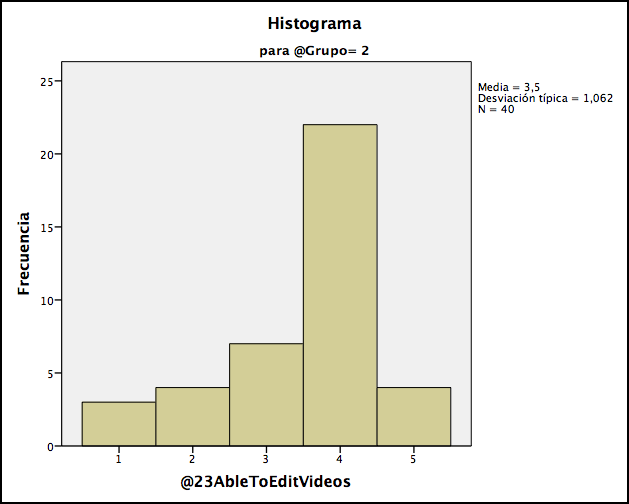
22.- Choose a grade of agreement: "I can edit videos with the appropriate devices and software"
|
|
Although the p-values are greater than 0,05 we notice that the p-value for 1-tailed is 0,275. If we consider the median, we see that the median in group 1 is 3 and it is 4 in group 2. So it has been a light increment in the video edition skills after participating in the project. Nevertheless, similar tasks of video edition should continue before the end of the project in order to change the tendency.
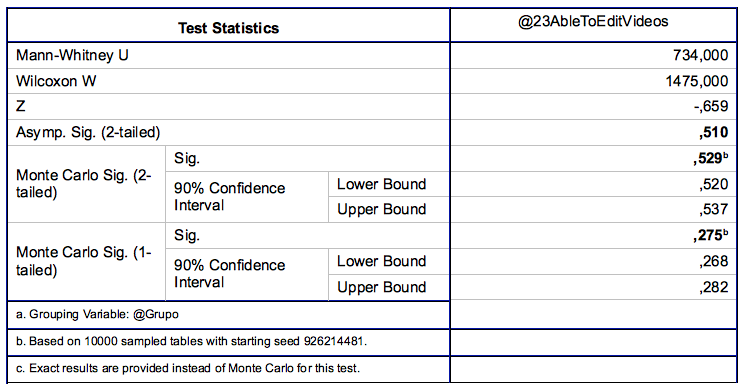
23.- If you were to edit a video, which would be your main drawback?
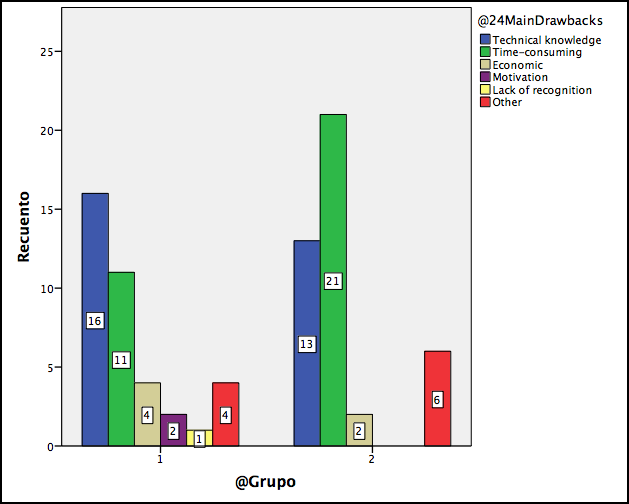
As the project goes on, we see that the technical knowledge is not the main drawback for video editing since the teachers have improved.
A second point is the time-consuming: the first drawback after participating in the project. Its increment is due to the new knowledge acquired by the teachers. They need more time to get the thing done since they know more about video edition.
The motivation has disappeared at all as a drawback. So participating in the project and collaborating with others increase the motivation.
24.- Write the ICT resources you use while teaching such as wikis, blogs, moodle, social networks, interactive whiteboards, etc.?
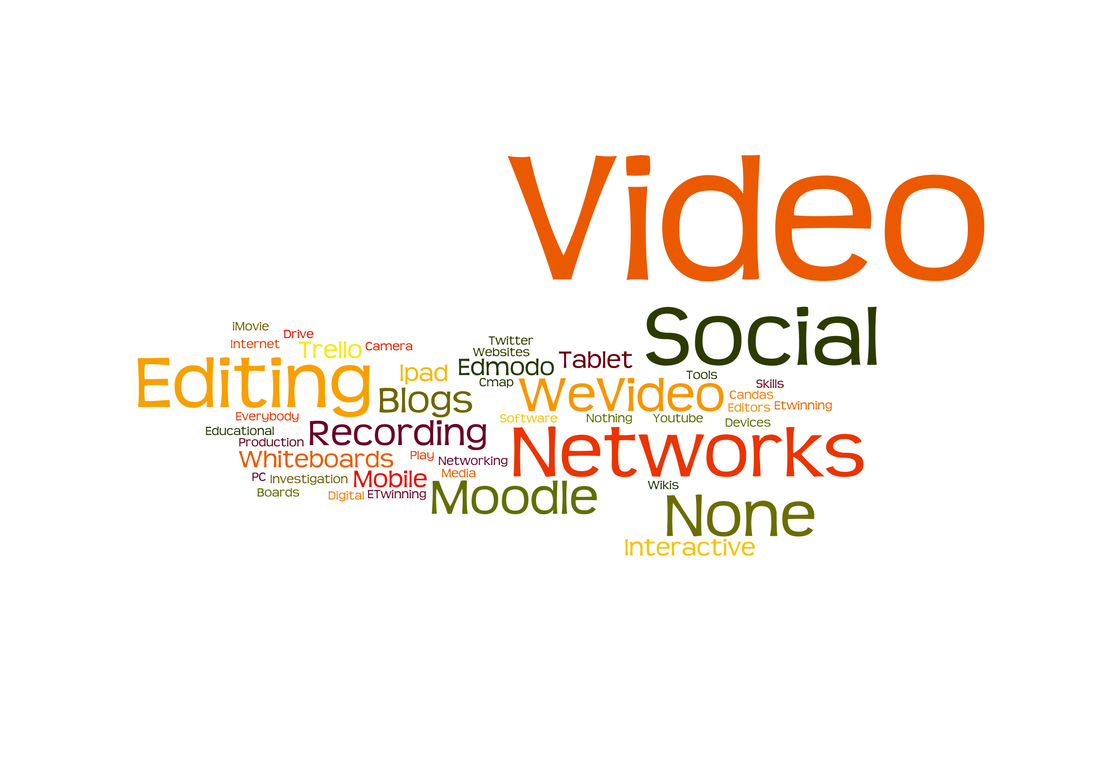
25.- Write the ICT resources you have added to you repertoir after enrolling in the ROE Project?

26.- Write the ICT resources you have improved after enrolling in the ROE Project?
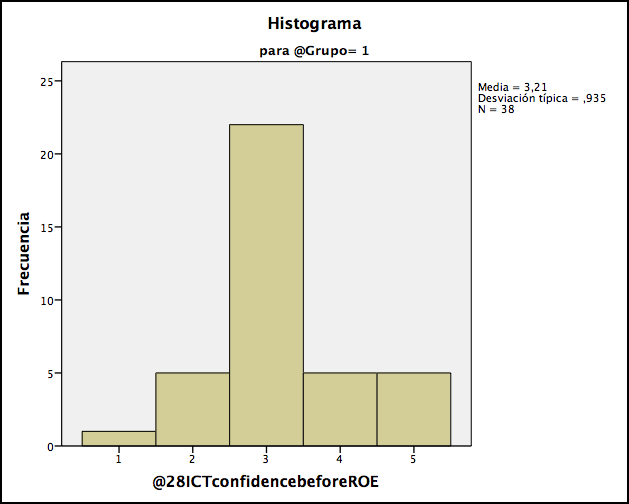
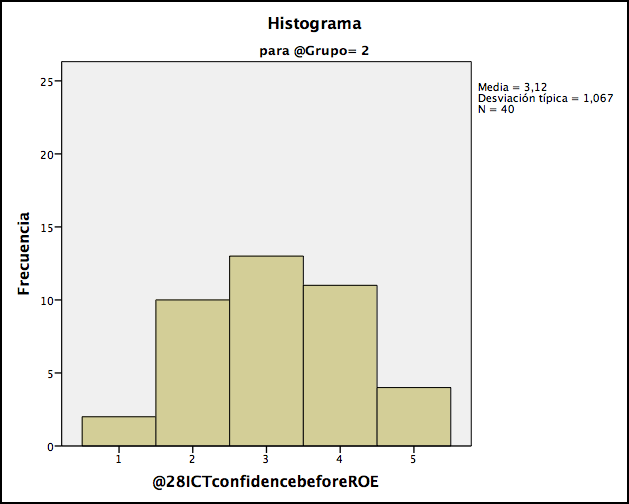
27.- Before the start of the ROE Project, my confidence in the use of the ICT was ...
|
|
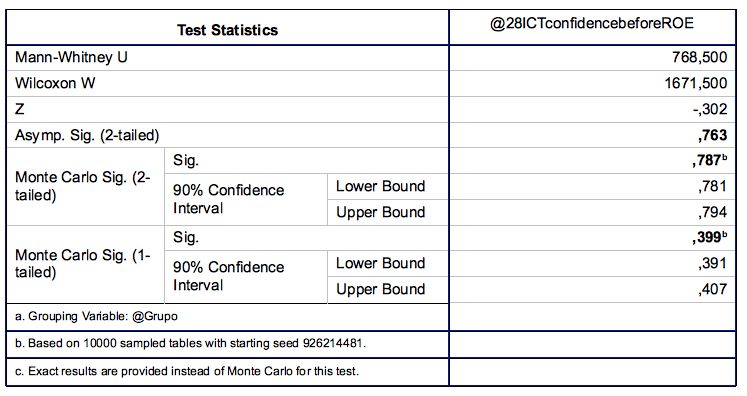
The p-values are greater than 0,05 and the medians in both groups are 3, so we can not use the M-Huber estimator. There is no difference regarding the ICT confidence before and after the participation in the project.
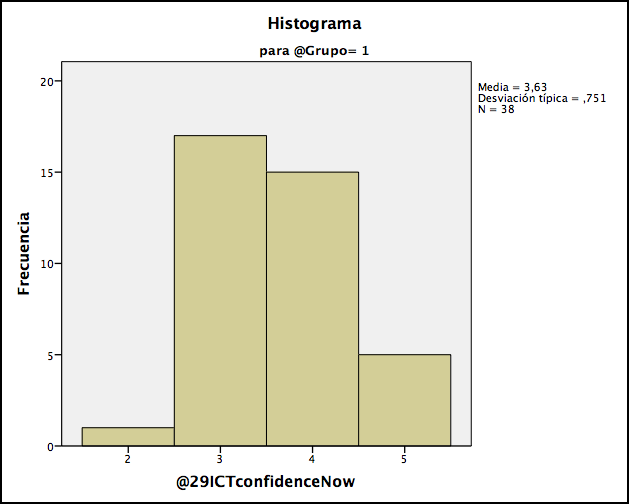
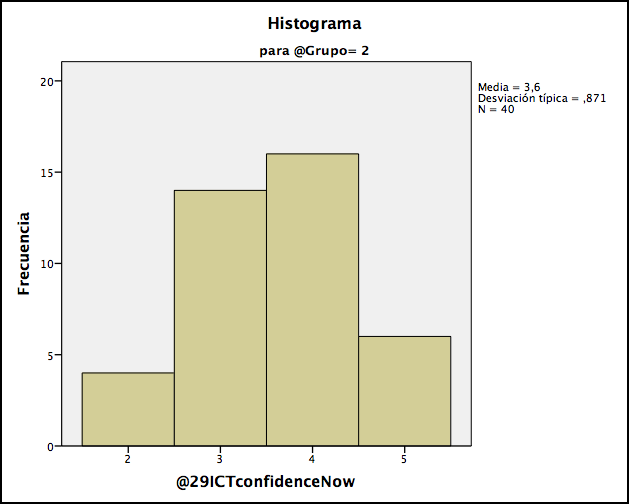
28.- At the present time, my confidence in the use of ICT is ...
|
|
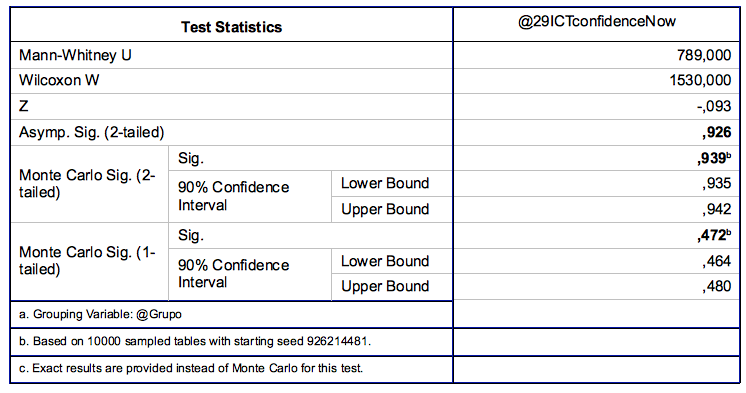
The p-values are greater than 0.05, the median in both groups are equal (4) and the M-estimators are very near so we can not see any difference between the two moments.
29.- Write two main advantages in the use of ICT with your students.
30.- Write two main disadvantages in the use of ICT with your students.
31.- Write two main advantages in the use of the video with your students.
32.- Write two main disadvantages in the use of the vid
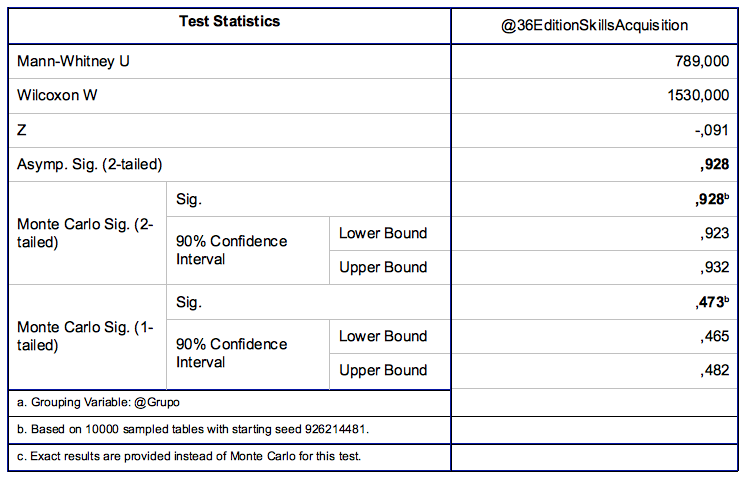
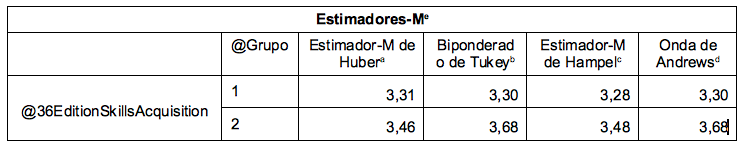
33.- I have acquired skills in the use of the video with my students.
|
|
Although the p-values are greater than cero and we cannot establish any differences, we see that the M-estimators increase poorly and the median in group1 is 3 and in group2 is 4. So some light changes have been produced for participating in the project but they do not show enough significance.
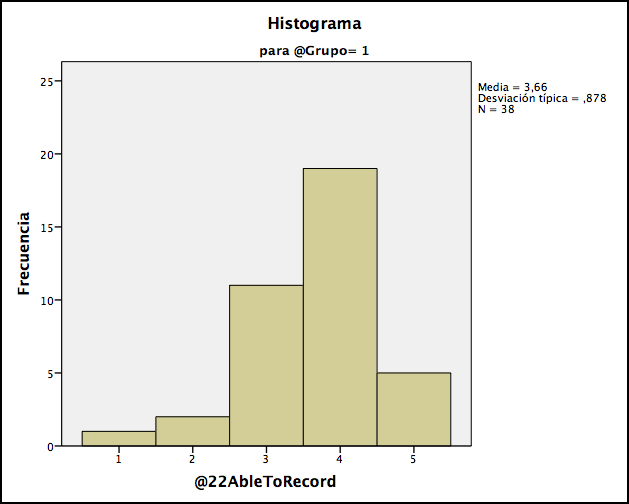
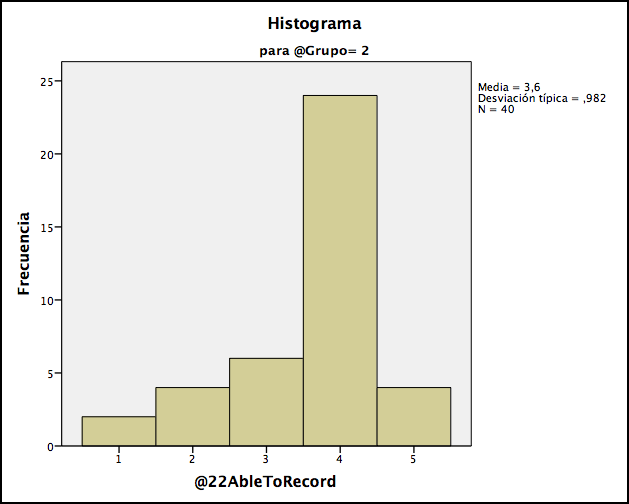
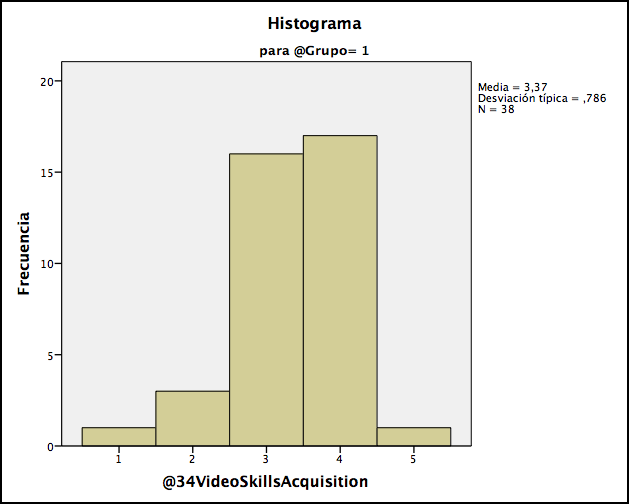
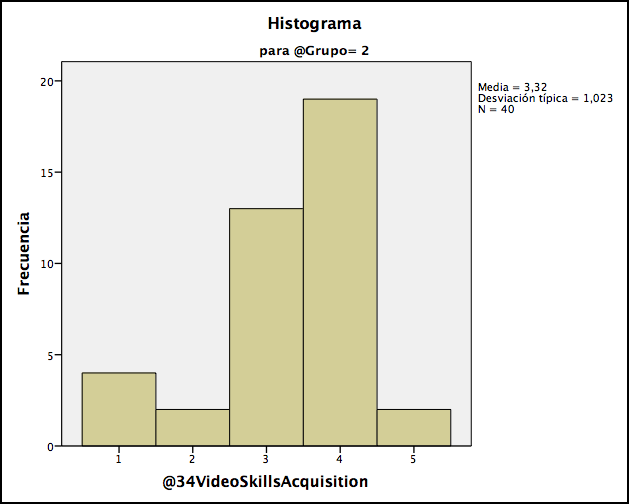
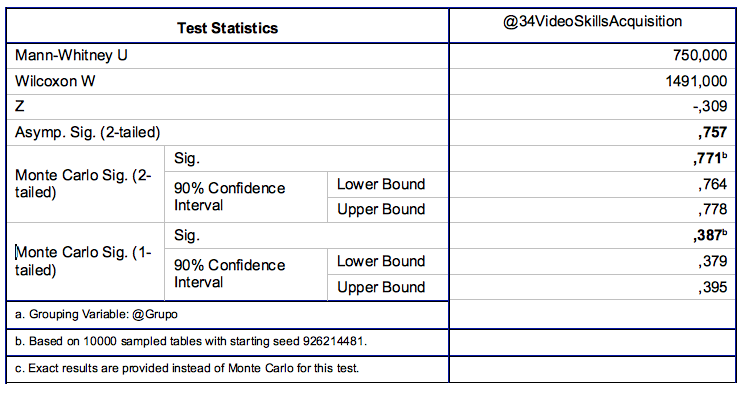
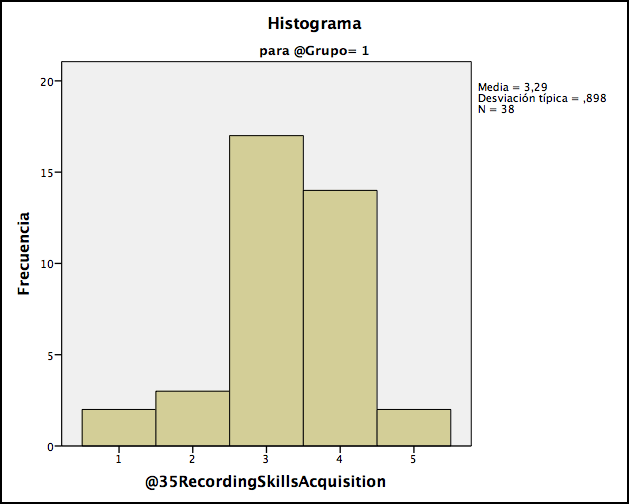
34.- I have acquired video recording skills for the teaching processes.
|
|
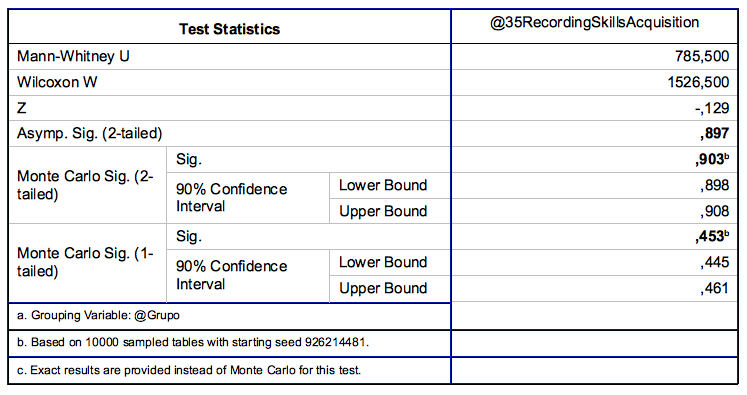
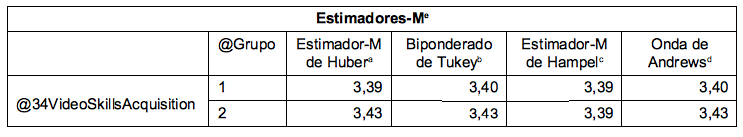
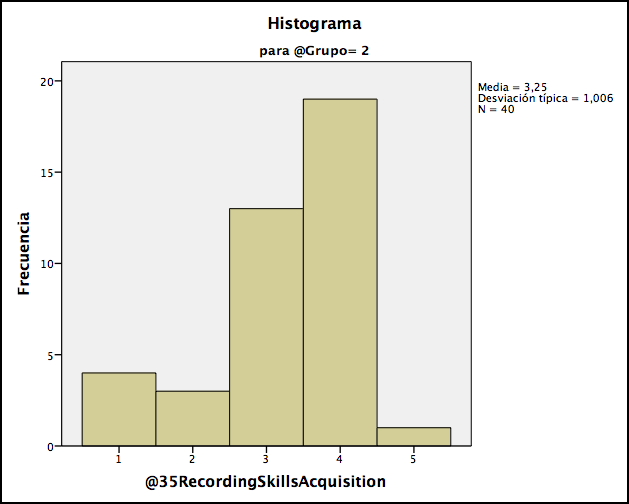
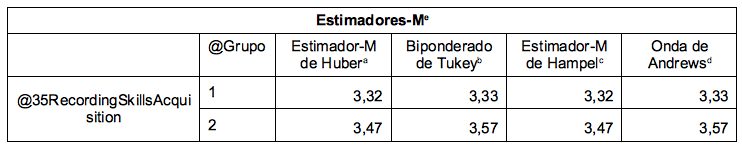
The median has increased from 3 to 3,50 so it seems a light improvement in the acquisition of recording skills. Moreover, the M-estimators have slightly increased as the readers can see below:
We can think that the changes in these estimators show a difference regarding the video recording skills. Nevertheless, the p-values are less than 0,05 so we cannot reject the null hypothesis that says there is no difference between the two groups.
35.- I have acquired skills in video edition and production.
|
|
This variable is similar to the precedent one. The p-values are greater than 0,05 so the null hypothesis cannot be accepted. We do not have enough information to be able to reject. For that reason, it is necessary to study the median and the M-estimators. The median goes from 3 in the first group to 3,50 in the second group.
Furthermore, all the M-estimators show increments so there are signs of a difference between the two moments with regard to the acquisitions of video edition and production skills.
Furthermore, all the M-estimators show increments so there are signs of a difference between the two moments with regard to the acquisitions of video edition and production skills.
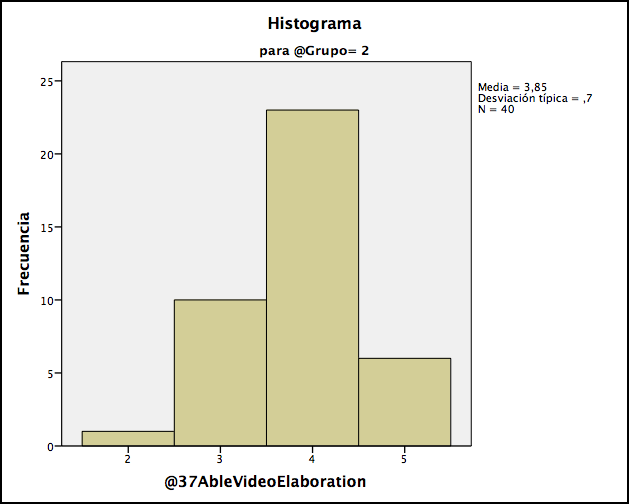
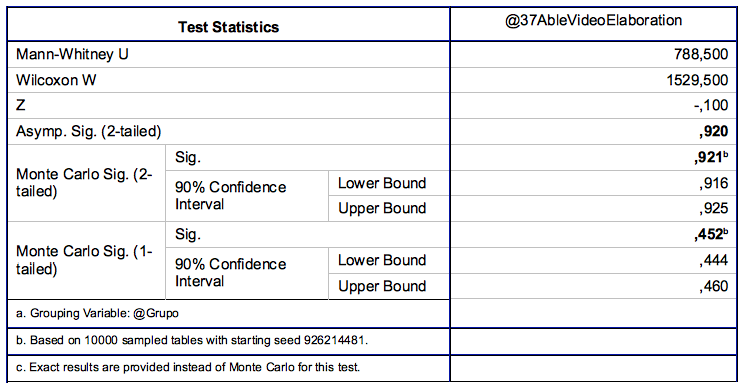
36.- Teachers should be able to elaborate their own educational videos.

|
|
There is no difference with regard to the elaboration of educational videos. The p-values are high and greater than 0,05. The median remain the same in both groups so the M-estimators cannot be computed properly.
37.- Teachers should have a database with appropriate videos of their subject.
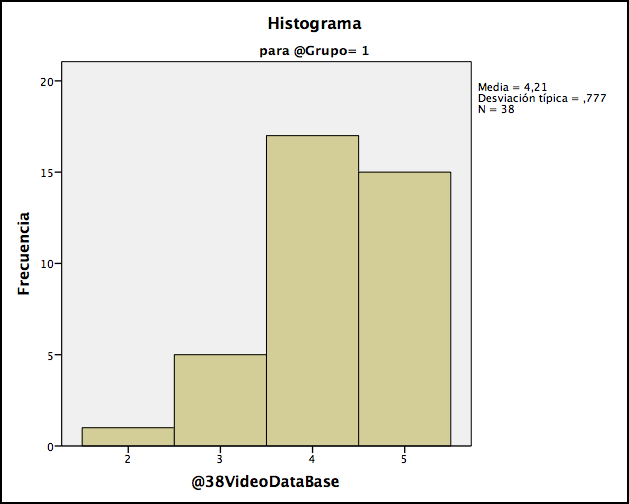
|
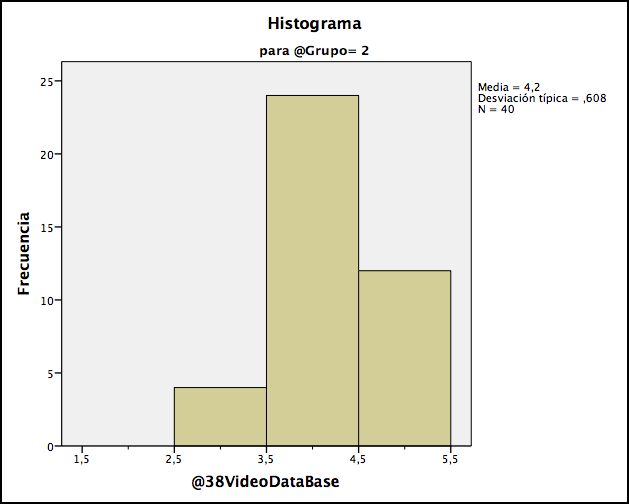
|
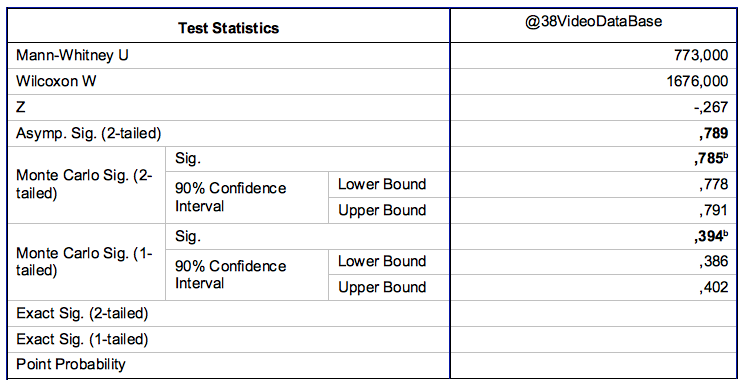
The p-values are greater than 0,05 so null hypothesis is rejected. There is no difference regarding the use of a personal video database of teachers subjects.
Additionally, most teachers agree or strongly agree about having a video database for educational purposes.
Additionally, most teachers agree or strongly agree about having a video database for educational purposes.
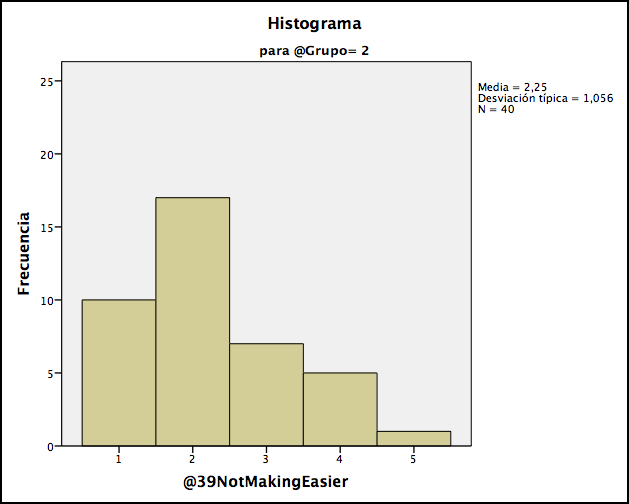
38.- The use of videos does not make easier the development of the learning and teaching processes.
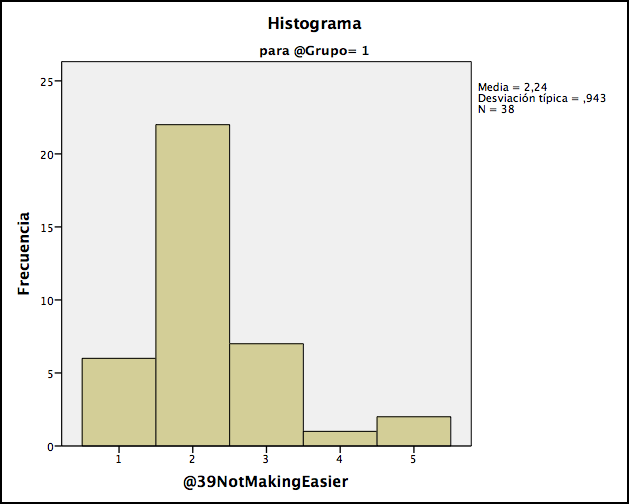
|
|
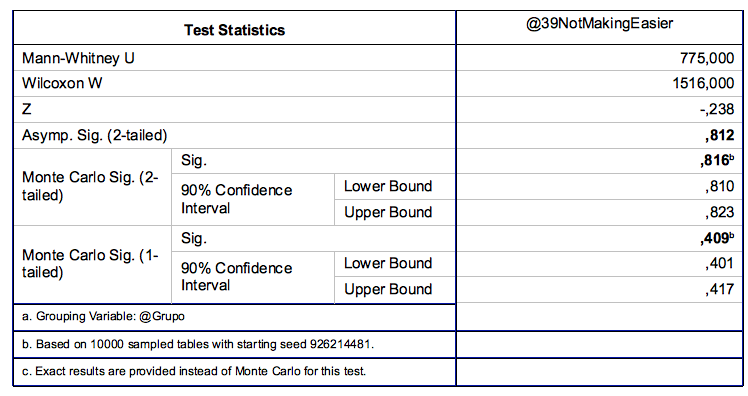
The p-values are greater than 0,05 so the test is not able to show a difference between groups about saying that the videos do not make easier the learning and the teaching processes. The median is 2 so at least 50% of the teachers disagree about it. Consequently, the rest of the teachers think that making videos ease the teaching and learning processes.
The aim of this question is not to contrast between groups but to rise grade of disagreement. A good median for this question would be 1 (strongly disagree).
The aim of this question is not to contrast between groups but to rise grade of disagreement. A good median for this question would be 1 (strongly disagree).
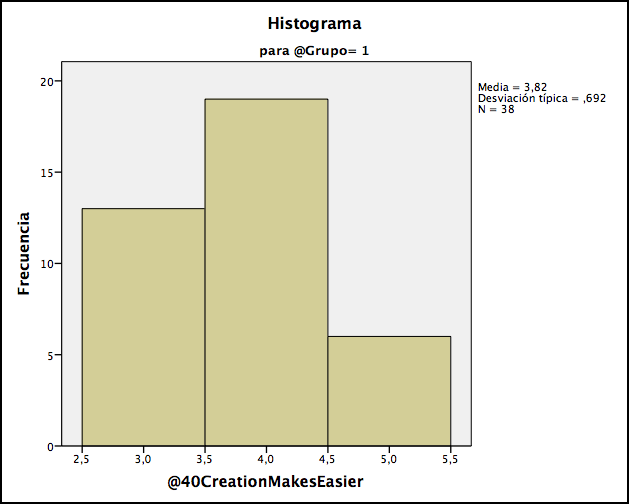
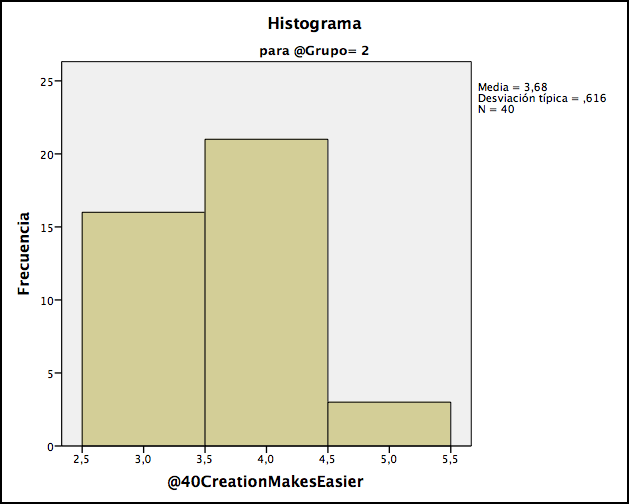
39.- The creation of videos makes easier my work in the school.
|
|
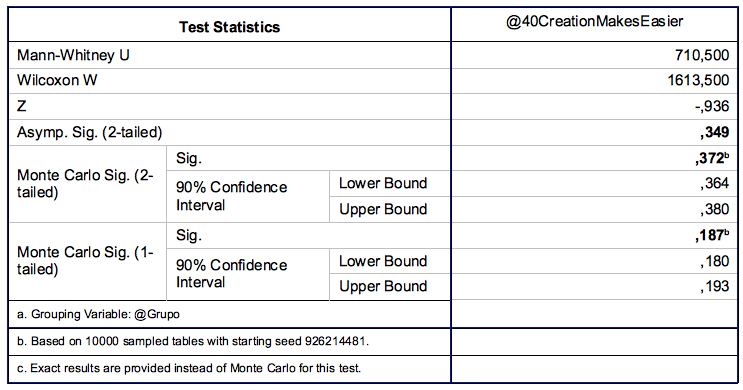
Although the p-values are greater than 0,05, the least of them is 0,187 for a 1-tailed contrast. Both distributions are centered at the median (4) so the M-estimators cannot be computed.
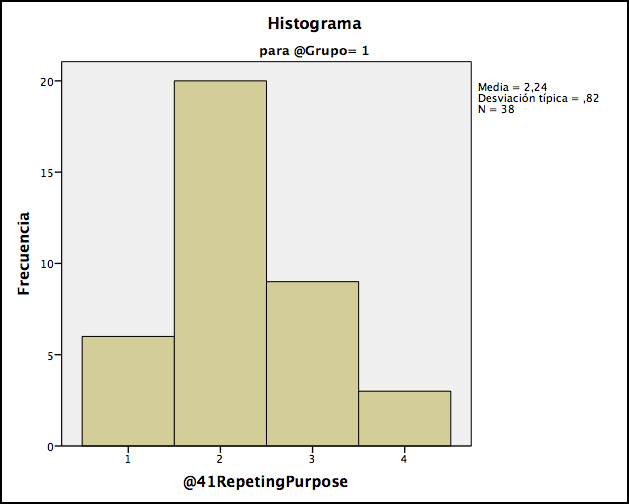
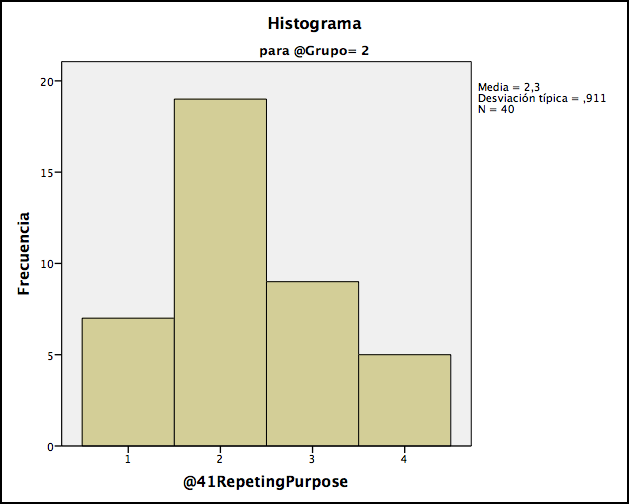
40.- The main purpose of the video is to repeat the class session.
|
|
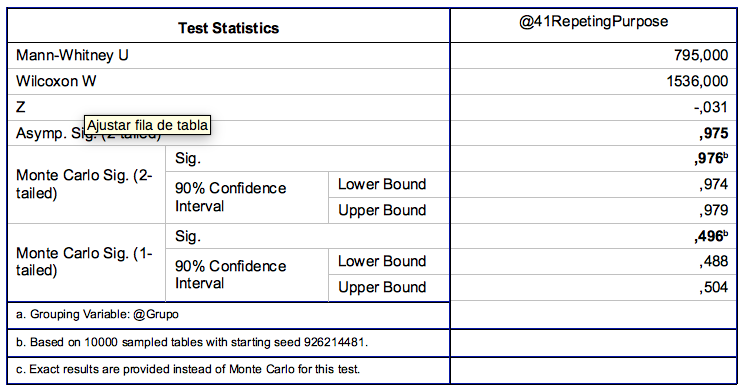
The p-values are greater than 0,05, the median (2) is the same in both groups, and the M-estimators cannot be computed because of it. There is no difference between both moments.
The most frequent answers is 2 that represents disagree so 50% of the people involved disagree about the repetition purpose of using the video in the classroom.
The most frequent answers is 2 that represents disagree so 50% of the people involved disagree about the repetition purpose of using the video in the classroom.
41.- When I want to learn something, I often use YouTube.
|
|
The p-values are greater than 0,05 so we cannot reject the hypothesis of no differences between the two groups. Since both distributions are centered at the median (3), M-estimators cannot be compute.
The use of Youtube, before and after the ROE, has not change.
The use of Youtube, before and after the ROE, has not change.
